
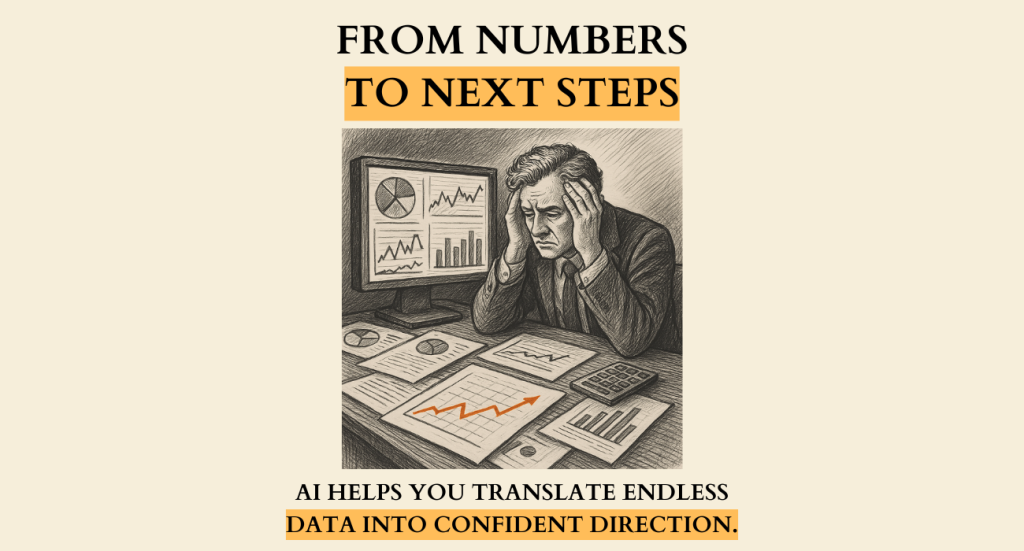
The Truth? Data ≠ Decisions.
Small business owners often assume that more data means more control. But data without interpretation leads to paralysis. This guide shows you how to turn raw numbers into clear, confident decisions—with AI, focused KPIs, and simple dashboards.
The Data Illusion
Walk into almost any business owner’s office and you’ll see numbers everywhere: dashboards filled with colorful charts, spreadsheets with endless tabs, and automated reports from accounting software. It looks like control. But here’s the catch: data ≠ decisions.
Data without context is just noise. And noise can disguise itself as progress while leaving you stuck in the same cycle of uncertainty.
Why More Data Doesn’t Equal More Control
- Vanity metrics distract you. Page views, impressions, or invoice counts don’t answer whether you can make payroll in 30 days.
- Dashboards multiply confusion. Ten charts on one screen is chaos at scale; you need fewer, sharper signals.
- Gut decisions still rule. If the data doesn’t change your next move, it’s decoration; not direction.
The Missing Link: Interpretation
Control doesn’t come from collecting data—it comes from interpreting it into choices.
The real question isn’t “Do I have data?” It’s “Does this data tell me what to do next?” A good dashboard should answer yes in under 60 seconds.
How to Turn Data Into Decisions
Use this three-step framework to move from information to action:
Step 1: Start With the Decision, Not the Data
Ask: What do I need to decide this month?
- Can I afford another employee?
- Do I need to cut expenses—or where?
- How much can I safely pay myself?
Once the decision is clear, work backward to the data you actually need.
Step 2: Limit Yourself to 7 KPIs
Seven is the sweet spot. Any more and you drift back into overwhelm. Core examples for U.S. small businesses:
- Net Profit
- Cash Runway (months you can operate safely)
- Break-Even Revenue
- Labor as % of Revenue
- Accounts Receivable Aging
- Debt Service Coverage
- Growth Rate (year-over-year)
Step 3: Use AI as Your Interpreter
AI can scan QuickBooks, spreadsheets, or raw reports and return plain‑English actions.
Copy-paste prompt:
Act as a CFO for a $2M [INDUSTRY] company in the USA.
Given this P&L and cash position [paste or describe], highlight the 3 biggest risks
to cash flow over the next 90 days and recommend the single highest‑leverage action
I should take first. Explain in simple terms.
The Role of AI Dashboards
- Surface the essentials. Show the 3 most urgent signals instead of 20 charts.
- Explain impact. “At this pace you’ll run out of cash in 54 days” beats a line chart with no context.
- Model scenarios fast. Hire vs. wait, price changes, or collections delays—see outcomes in seconds.
FAQ\’s
What’s the fastest path from data to decisions?
Start with the decision you need to make, limit your view to 7 KPIs, and use AI to translate numbers into a recommended next action.
Which KPIs matter most?
Net Profit, Cash Runway, Break‑Even Revenue, Labor %, AR Aging, Debt Coverage, and YOY Growth cover most U.S. small businesses.
Do I need QuickBooks connected?
It’s the easiest way to ensure accurate, up‑to‑date numbers that can feed your dashboard automatically.
Conclusion: Less Data. More Decisions.
Data ≠ control. Decisions = control. Your numbers only matter if they guide your next step. Stop chasing more data and start demanding clarity.
Take the Profit Performance Quiz to see where your financial clarity breaks down and get your Profit Performance score.


